NOTE: This function is only available in the stand-alone/compiled release of SVAR.
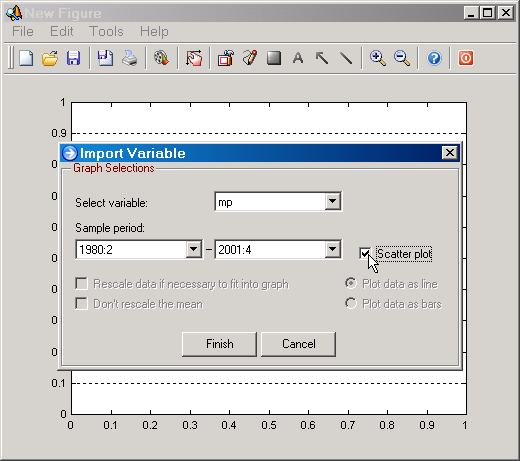
Create a new figure window from, for instance, the Graphics|New Figure submenu on the main program window. Right click anywhere on the axes, and select Import Data from the context menu. Select the file that contains the data to plot. On the Import Variable dialog (see below), select the sample you want to use, any variable (you can change this choice below), and check mark the Scatter plot option (see Figure below).
|
Figure: Importing data for creating a scatter plot. |
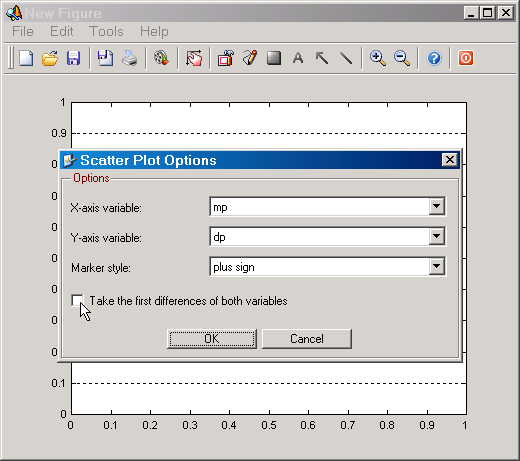
Selecting Finish will result in the appearance of the Scatter Plot Options dialog (see Figure below). On this dialog you can select the variable for the X-axis, the Y-axis, the marker style to use in the scatter plot, and if first differences should be taken of the variables. Clicking on the OK button finishes the function.
|
Figure: The scatter plot options dialog. |
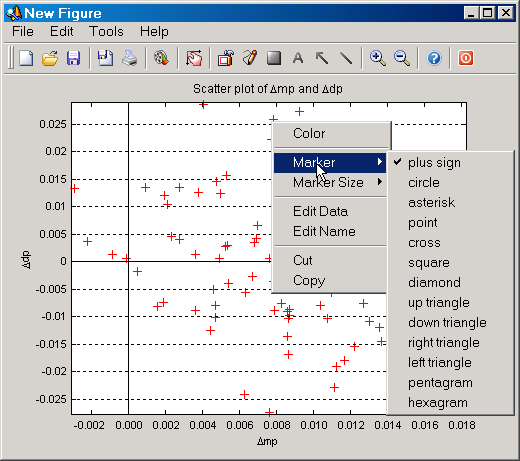
Clicking on OK produces the following results (when the Take the first differences of both variables option has been check marked):
|
Figure: A scatter plot of first differenced variables with the context menu for the scatter plot object opened. |