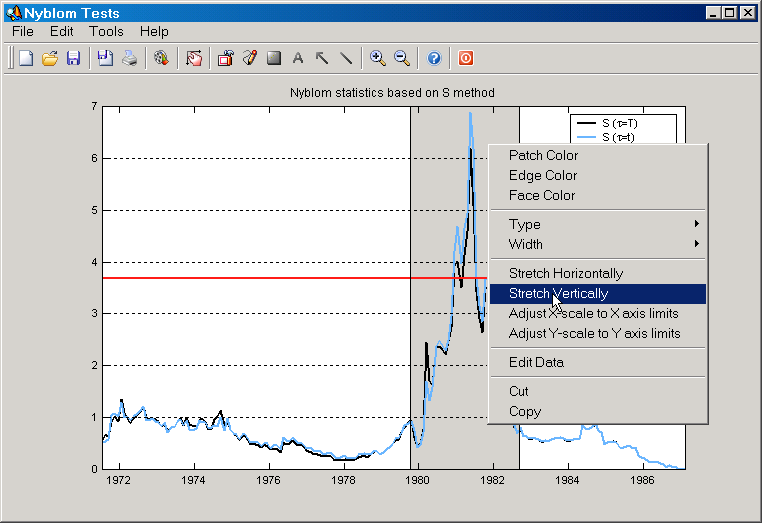
Rectangles can only be produced in 2D plots. To create one either click on the "Rectangle" button on the toolbar, or the "AddèRectangle" item on the Edit Menu. You need to click and hold the mouse button down on an axes object, then drag the cursor and release it. A rectangle is actually a patch object and its context menu therefore shares many of the tools found on the Bar/Patch Context Menu.
| • | Patch Color: Select a new color for the whole patch or bar via a color picker dialog. |
| • | Edge Color: Select a new edge color for the patch or bar. |
| • | Face Color: Select a new face color for the patch or bar. |
| • | Type: Change the edge type for the patch or bar. You can choose between solid, dashed, dotted and dash-dotted. |
| • | Width: Change the width of the edge. You can choose between width numbers between 1 point and 10 points. |
| • | Stretch Horizontally: Stretches the rectangle to the limits of the X axis. |
| • | Stretch Vertically: Stretches the rectangle to the limits of the Y axis. |
| • | Edit Data: Open the Edit Data dialog. |
| • | Cut: Delete the rectangle. |
| • | Copy: Copy the patch data into the internal SVAR "Clipboard". Makes it possible to paste it into any axes object; see Axes Context Menu for details. |
|
Figure: The context menu for rectangles in SVAR. |