


Lines are typically found on 2D graphs. You can change most of a line's properties via its context menu.
|
Figure: The line context menu in SVAR opens when you right click on a line in a graph. |
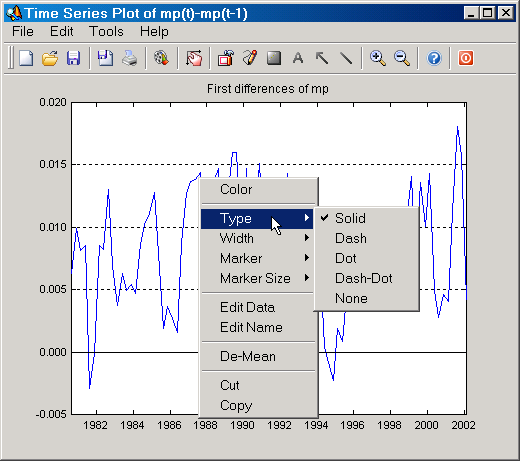
On the line context menu you'll find the following tools:
| • | Color: Change the color of a line via a color picker dialog. |
| • | Type: Select the line type. You can choose between solid, dashed, dotted, dash-dotted and none. The last option makes a line invisible. To make such hidden lines visible again, click on the "Show Hidden Lines" item on the Tools Menu; see Menus for details. |
| • | Width: Select the line width. You can choose between 1 up to 10 points. |
| • | Marker: Select the line marker. You can choose none and 13 alternatives, ranging from plus signs, circles, to hexagrams. |
| • | Marker Size: Select the size of markers for a line. You can choose in the range of 1 point up to 16 points. |
| • | Edit Data: Opens the Edit Data dialog. This function is not available for 3D-lines. |
|
Figure: The Edit Data dialog. |
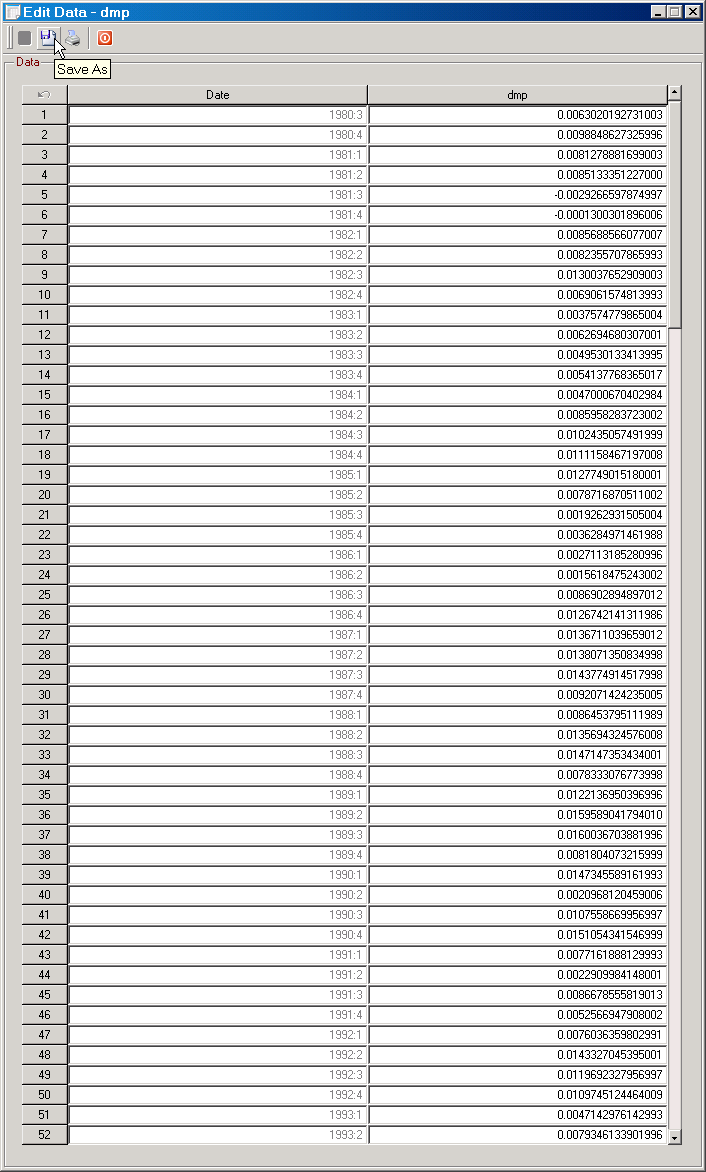
| • | Edit Name: Opens the Edit Name dialog for changing the name of a line. This function is not available for 3D-lines. |
| • | De-Mean: Removes the mean from the line. Requires that the line represents a time series. |
| • | Cut: Delete the line from the axes object. |
| • | Copy: Copy a line. Makes it possible to paste it into any axes object; see Axes Context Menu for details. |